Seasonal & Surge Operations
How to Build a Customer Support Forecast
A useful forecast is not a monthly ticket guess. It is an operating model that connects business drivers to contact propensity, channel volume, handle time, workload, coverage, and risk - then learns from what actually happened.

A forecast is a decision model, not a prediction contest
Most forecasting conversations start in the wrong place. We ask, 'How many contacts will we get next month?' That is a reasonable question, but it is not the operating problem. The operating problem is: what demand should we expect, how much work will that demand create, when and where will it arrive, and what decisions do we need to make because of it?
That distinction matters because a forecast can be numerically respectable and still be operationally useless. A monthly volume number can land close to actuals while the busiest Tuesdays are badly wrong. Total contacts can be right while channel mix shifts. Volume can be right while average handle time rises. Any of those misses can leave the operation under-capacity exactly when customers feel it.
So I would define a support forecast as a set of linked assumptions that turn business activity into expected workload over time. The goal is not clairvoyance. The goal is a model you can operate.
1. Start with the decision you are trying to make
Forecasting has different jobs at different horizons. Long-range planning informs budgets, hiring, partner commitments, and location or capacity decisions. Short-range forecasting informs schedules and interval staffing. Intraday forecasting tells you whether the day is departing from plan quickly enough to trigger a response.
Those are not the same problem at different zoom levels. They use different granularity, different signals, and different tolerances for error. Current workforce-management platforms reflect this separation: Amazon Connect, for example, distinguishes long-term, short-term, and intraday forecasting, while scheduling and capacity planning consume forecasts at different horizons.
Before building the model, write down the decision. 'We need a 12-month hiring plan' is different from 'we need staffing by 30-minute interval three weeks from now.' If the decision is vague, the forecast will be vague too.
2. Forecast volume and handle time separately
Contact volume is only half the demand equation. The other half is how much effort each contact requires.
At the simplest level, raw workload is:
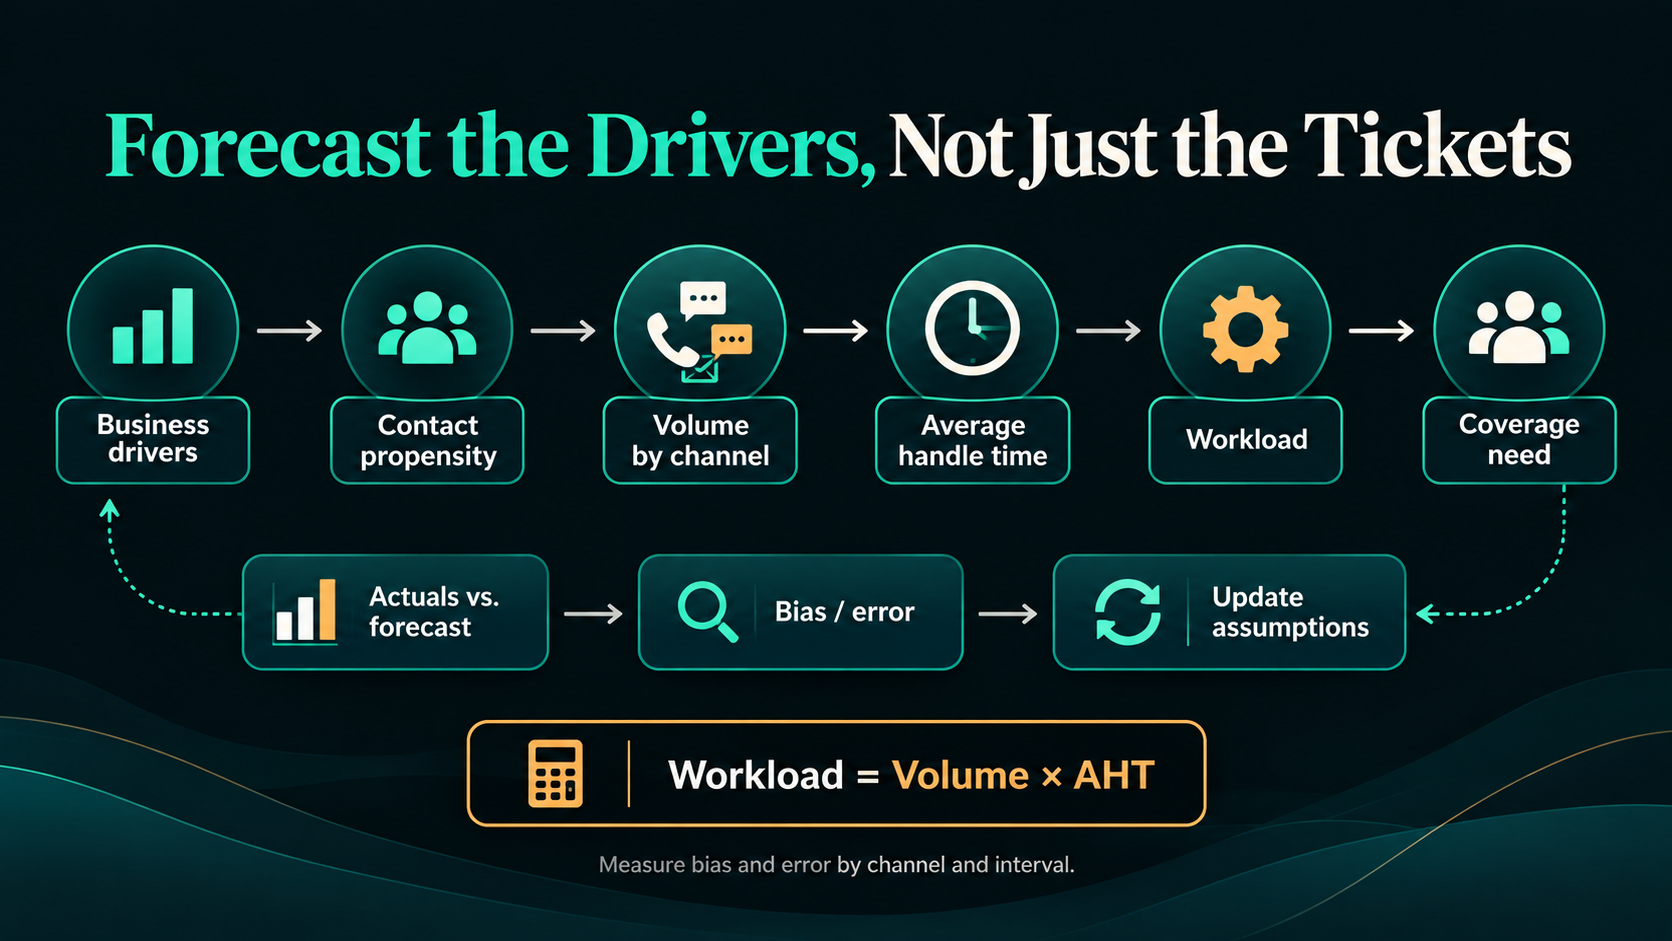
Workload = Volume x Average Handle Time
If you forecast 10,000 contacts at six minutes each, you have 60,000 minutes of raw work. If volume is exactly right but handle time rises to seven minutes because a product issue makes the remaining contacts harder, workload is 16.7% higher even though your volume forecast was perfect.
This is especially important in an AI-enabled operation. Automation can remove simple contacts, but that may increase the complexity of the work that reaches a person. A lower contact count does not automatically mean a proportional reduction in human workload. Forecast volume and AHT separately, by the segments that matter.
3. Model the drivers between the business and the queue
Historical contacts are useful, but history is not a causal model. If the business changes, a forecast built only on yesterday's contact curve can fail for perfectly understandable reasons.
A stronger model starts with the business drivers that create support demand: active customers, orders, shipments, claims, transactions, renewals, launches, billing cycles, marketing campaigns, deadlines, incidents, or whatever actually causes customers to need help. Then estimate contact propensity - how many contacts those business events tend to create - and how that demand splits by channel and reason.
Conceptually, the chain looks like this:
Business driver -> contact propensity -> volume by channel -> AHT -> workload -> coverage need
You do not need a perfect econometric model to benefit from this structure. Even a simple driver model forces the team to state the assumptions that matter and makes it easier to explain why the forecast changed.
4. Work at the granularity where operations can act
A monthly total is useful for finance. It is usually not enough for workforce management.
For synchronous channels such as voice, the arrival pattern matters. A day can finish exactly on forecast while suffering a severe two-hour spike that breaks service levels. That is why modern WFM systems forecast and schedule at interval granularity - commonly 15 or 30 minutes - and why intraday tools compare actual volume, AHT, and staffing against the short-term plan as the day unfolds.
For asynchronous work such as email or tasks, the timing model may be different because some work can be deferred. But deferrable does not mean free. Backlog is simply demand moved forward in time, and the forecast needs to model the carryover if today's capacity cannot finish today's work.
5. Treat known events as first-class inputs
The calendar already knows things your time series does not. Product launches, holiday hours, billing changes, promotions, migrations, renewals, policy deadlines, releases, planned outages, tax season, open enrollment, and major customer communications can all change demand before they ever appear in historical data.
I like to separate the baseline from event adjustments. The baseline answers, 'What would demand look like if the business behaved normally?' The event layer answers, 'What do we know is different this time?' That separation makes overrides auditable and keeps one unusual event from contaminating the model forever.
It also creates a practical operating ritual: maintain a forward event calendar, assign an owner to each material event, estimate its demand effect, and compare the estimate with what actually happened afterward.
6. Publish a range, not just a point estimate
A forecast that says 12,437 contacts creates a false sense of precision. The real question is what range of demand is plausible and which decisions change across that range.
For operational planning, I would normally want at least three views: a base case, a reasonable high case, and a reasonable low case. The width of that band should expand where uncertainty is higher - for example, around a new launch with little history - and narrow where the process is stable.
The point of the range is not to make the forecaster impossible to prove wrong. It is to connect uncertainty to capacity decisions. What capacity is committed in the base case? What flex is available if the high case begins to materialize? At what point do we activate it?
7. Translate demand into workload before translating it into people
One of the easiest forecasting mistakes is jumping from contacts directly to headcount. First convert contacts into workload. Then convert workload into the coverage requirement for the service objective, channel, concurrency, occupancy, shrinkage, skill mix, and schedule pattern you actually operate.
For a multi-channel operation, I would think about raw workload as the sum across channel-skill segments and intervals:
Workload = SUM(Volume[c,i] x AHT[c,i])
That number is not the staffing answer. Synchronous queues have queueing effects: coverage cannot be sized by simply dividing workload by paid hours and expecting the service level to take care of itself. Asynchronous work can tolerate delay, but backlog and aging constraints still matter. Forecasting should hand a clean workload model to the capacity and scheduling logic rather than pretending the conversion is linear.
8. Measure error in the variables that drive the operating result
A forecast should be scored, but one accuracy number is not enough. I want to know at least four things: volume error, AHT error, workload error, and bias.
Bias answers whether we systematically forecast high or low. Absolute error answers how far we miss regardless of direction. For an operating scorecard, a weighted absolute percentage error can be useful because it avoids letting tiny intervals dominate the metric simply because their percentage error is huge. But the aggregate score still needs to be decomposed by channel, skill, day, and interval.
There is also a useful mathematical reminder here. Workload is the product of volume and AHT, so errors compound. If volume is 10% above forecast and AHT is also 10% above forecast, workload is about 21% above forecast - not 20%. When the queue is already tight, that interaction term matters.
The forecast-review meeting should therefore ask not only 'Were we accurate?' but 'Which assumption failed, what was the operating consequence, and should the model change?'
9. Reforecast at multiple horizons
A forecast should not become sacred because it was published. New information arrives continuously.
Long-range forecasts should update when the business plan changes. Short-range forecasts should absorb the newest demand and event information. Intraday controls should compare actuals with the published plan and project the remainder of the day so operators can decide whether to move breaks, offer overtime, open flex capacity, reroute work, or accept a controlled backlog.
This is where forecasting becomes a control system: observe, compare, decide, act, measure, relearn. A static spreadsheet can contain a forecast. A mature operation has a forecasting loop.
10. Build AI into the assumptions, not just the tooling
AI can improve forecasting models, but the bigger planning issue is that AI changes the thing being forecast.
If an AI agent resolves 30% of a contact reason, what happens to the remaining 70%? Does channel mix change? Does AHT rise because the easy cases disappeared? Does repeat-contact behavior change? Does a new automated workflow create a new failure mode that generates contacts of its own? Those are operating assumptions, not software settings.
I would explicitly track automation and self-service effects in three places: contact propensity, channel mix, and AHT/complexity. That gives the model a way to learn whether an AI deployment is truly removing workload or merely moving it around.
11. Give the forecast an owner and a cadence
Good forecasts are cross-functional because the signals live in different parts of the business. Finance has the corporate plan. Product has launches and releases. Marketing has campaigns. Operations has contact behavior. Workforce management understands interval demand. BPO partners may see hiring and attendance constraints that internal planning does not.
Someone still has to own the model. Ownership means maintaining assumptions, documenting overrides, publishing the current version, measuring error, and forcing the feedback loop to happen. A monthly finance sync, a weekly operations refresh, and a daily or intraday variance review may all use the same model at different speeds.
The best forecast is not the one with the fanciest algorithm. It is the one the organization can explain, update, challenge, and use to make decisions before the queue tells you that you were wrong.
Build the forecast you can operate
The old version of this advice was basically: pull history, extend the trend, check with finance, and adjust for what you know. That is still a decent starting instinct. It is just not enough for a modern customer operation.
A stronger forecast connects business drivers to contact propensity, volume, handle time, workload, and coverage. It operates at the right granularity. It separates baseline demand from known events. It publishes uncertainty. It scores its own errors. It refreshes at multiple horizons. And it treats AI as a changing assumption inside the operating model, not a magic forecasting button.
Forecasting is not about proving that the future is predictable. It is about making uncertainty explicit early enough that the operation can do something useful about it.
Sources & References
- Amazon Connect Customer. Forecasting in Connect Customer — Current documentation describing long-term, short-term, and intraday forecasting and volume/AHT forecastingReference 1
- Amazon Connect Customer. Intraday forecast performance dashboard — Current documentation describing intraday comparison of actuals with forecasts, including contact volume, AHT, and effective staffingReference 2
- Amazon Connect Customer. Capacity planning — Current documentation showing how long-term and short-term forecasts feed capacity and scheduling plansReference 3
- NiCE CXone. General Forecast — Current documentation showing expected volume, AHT, and staffing as core forecast outputsReference 4
- NiCE CXone. True to Interval Paradigm — Current documentation describing interval-level volume and handle-time treatment for WFM forecastingReference 5